
Neumont, by the numbers.
Neumont measures success by student outcomes. Hence, we focus on who we serve, how they progress, whether they graduate, and where their education takes them afterward. This page brings together key measures of student access, completion, employment, and return on investment, along with independent data that places those outcomes in context.
The figures on this page are for Neumont University. To see how Neumont compares with peer institutions, read the peer comparison report →
(first-time, full-time students, 150% of normal time)
(BS Software & Game Development)
(BS Computer Information Systems)
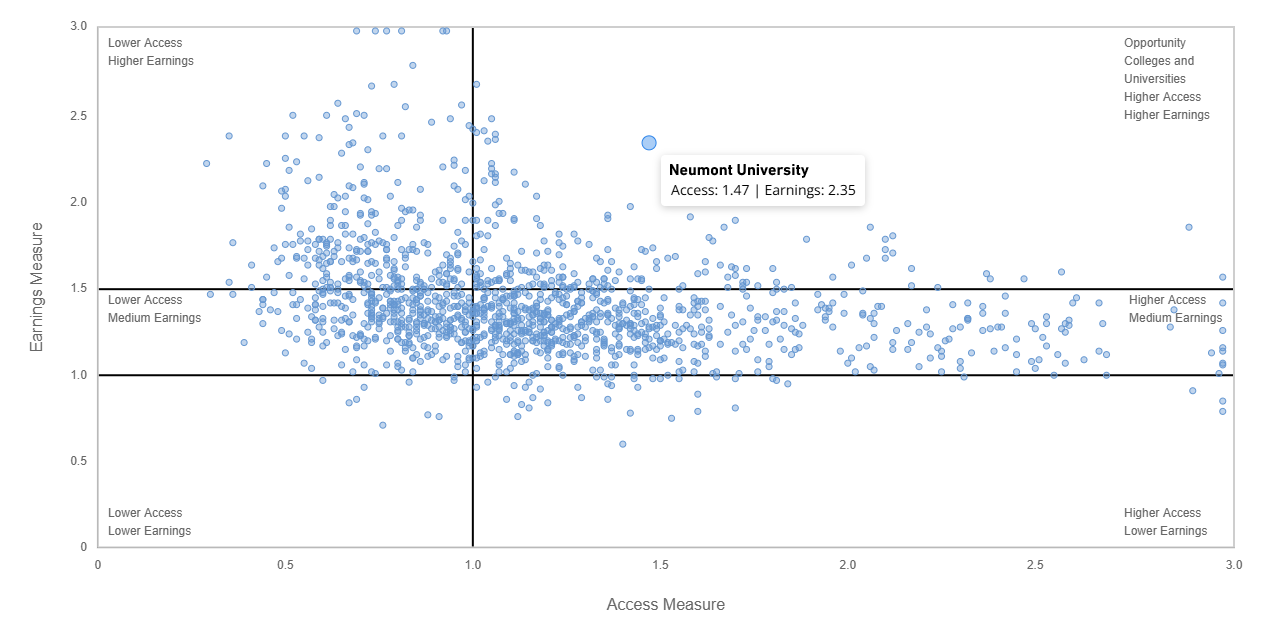
Independently ranked for opportunity and ROI
Researchers who measure what a degree actually returns — student access and post-graduation earnings, not prestige — keep reaching the same conclusion about Neumont.
Who starts at Neumont
A snapshot of the students who began their studies in 2019 — the same cohort whose graduation outcomes appear in the next section. Figures are the share of the entering class.
Show entering class by home region (headcount)
| Region of origin | Students | Share |
|---|---|---|
| Utah | 46 | 23.2% |
| Mountain (non-Utah) | 26 | 13.1% |
| West South Central | 23 | 11.6% |
| Pacific | 21 | 10.6% |
| South Atlantic | 18 | 9.1% |
| East South Central | 17 | 8.6% |
| Mid-Atlantic | 15 | 7.6% |
| Midwest (East) | 11 | 5.6% |
| Midwest (West) | 10 | 5.1% |
| Northeast | 7 | 3.5% |
| Other | 3 | 1.5% |
| Not specified | 1 | 0.5% |
| Total entering class | 198 | 100% |
“Not recorded” under race & ethnicity is the balance of the cohort for whom a race/ethnicity value was not on file. Two geography groupings appear on this page and differ by design: “Utah neighbor states” (12.6%) counts only states that share a border with Utah, while the broader “Mountain (non-Utah)” region in the table below (13.1%) also includes non-bordering Mountain states such as Montana.
First-year retention
The share of first-time students pursuing bachelor’s degrees who began their studies in Fall 2023 and returned in Fall 2024.
128 of 173 students returned the following fall.
Retention by student group
First-time, full-time cohort (173 students). Cohort average: 74%.
Show retention data table
| Group | Cohort | Returned | Rate |
|---|---|---|---|
| All first-time, full-time | 173 | 128 | 74% |
| Male | 151 | 112 | 74% |
| Female | 22 | 16 | 73% |
| White | 83 | 60 | 72% |
| Non-White | 61 | 45 | 74% |
| Race not reported | 29 | 23 | 79% |
Rates follow the federal (IPEDS / College Navigator) definition of first-year retention for first-time, full-time students. To protect student privacy, all reported non-white racial/ethnic groups are combined into a single “Non-White” category, and “Race not reported” covers students with no race/ethnicity on file. This cohort began in Fall 2023 — a more recent group than the 2019 cohort used for graduation, because retention is measured one year after entry.
How the 2019 cohort graduated
Neumont measures the graduation of its 2019 entering class two ways. Both track the same students to completion within 150% of normal program time — they differ only in who is counted.
First-time, full-time students only. This is the federally reported, peer-comparable rate.
All students who started in 2019, including part-time and returning students.
Graduation rate by program
First-time, full-time students (IPEDS). The dashed line marks the 58% overall IPEDS rate.
Graduation rate by student group Federally required · IPEDS
First-time, full-time students — the graduation data required and publicly disclosed under IPEDS. Overall rate for this group: 58%.
This first-time, full-time breakdown is the graduation data required and publicly disclosed under IPEDS. NA = not applicable / not reported. Some subgroups reflect very small numbers of students, which can produce rates of 0% or 100%.
Beyond the federal report — full 2019 cohort
Additional, non-required views covering all 2019 starters (cohort average 54.55%), including age and geography — dimensions the IPEDS report does not provide.
Full-cohort figures count all 2019 starters (part-time and returning students included), so they differ from the first-time, full-time IPEDS rates above. Groups marked (small n) contain very few students; read their extremes with caution. Full-cohort gender, race, and Pell figures appear in the data table below.
Show full graduation data (both populations)
| Group | Full cohort (all students) | IPEDS (first-time, full-time) |
|---|---|---|
| Overall | 54.55% | 58% |
| Male | 53.61% | 59% |
| Female | 56.67% | 52% |
| Pell-eligible / Pell recipient | 52.67% | 54% |
| Not Pell | 58.21% | 60%–75%* |
| White | 52.25% | 50% |
| Non-White (aggregate) | 48.00% | — |
| Age 17 or younger | 66.67% | — |
| Age 18–19 | 54.44% | — |
| Age 20–24 | 45.00% | — |
| Age 25–29 | 80.00% | — |
| Age 30 or older | 100% | — |
| Utah | 54.35% | — |
| Utah neighbor states | 64.00% | — |
| Elsewhere in the U.S. | 52.38% | — |
*IPEDS reports two non-Pell categories for first-time, full-time students: those receiving a Subsidized Stafford Loan but not Pell (60%) and those receiving neither (75%). IPEDS also reports finer race/ethnicity detail (American Indian/Alaska Native 0%, Asian 100%, Black 36%, Hispanic/Latino 52%, White 50%, Two or more races 0%, unknown 73%) — several of which reflect very small cell sizes. The full IPEDS disclosure is available via College Navigator, linked on the Consumer Information page.
2024 employment outcomes
Based on graduates who completed their program during the 2024 calendar year and were available for employment. Graduates pursuing further education, serving in the military, residing internationally, medically disabled, incarcerated, or deceased are excluded from the available-for-employment population.
Show data table
| Degree | Available for employment | Employed in field | Employed (any) |
|---|---|---|---|
| BS Business Technology Management | 7 | 4 (57%) | 5 (71%) |
| BS Computer Information Systems | 14 | 9 (64%) | 13 (93%) |
| BS Computer Science | 22 | 14 (64%) | 20 (91%) |
| BS Software & Game Development | 24 | 7 (29%) | 17 (71%) |
| BS Software Engineering | 18 | 12 (67%) | 16 (89%) |
| BS Web Design & Development | 9 | 2 (22%) | 8 (89%) |
| AS Software Development | 21 | 2 (10%) | 6 (29%) |
Employed in Field: graduates employed in positions directly related to their field of study. Employed: graduates employed in any position, regardless of whether it is related to their field of study.
Methodology: Employment outcomes are verified through written documentation provided by the graduate, direct confirmation from the employer, or alternative verified professional sources in accordance with national career services reporting standards. Verification includes the employer name, job title, and employment start date. Employment statistics are based on information available and verified at the time the data is compiled. Neumont does not conduct ongoing follow-up research regarding graduates’ employment status after the initial employment verification. Neumont University does not guarantee employment, salary levels, or career outcomes for any student or graduate.